Data silos are not a storage problem.
They are a decision-making problem.
When business decisions depend on traffic trends, lead conversion rates, CRM pipeline health, and sales performance, having that data spread across isolated systems means someone is always working with incomplete information. Or worse, they are stitching spreadsheets together the night before a review.
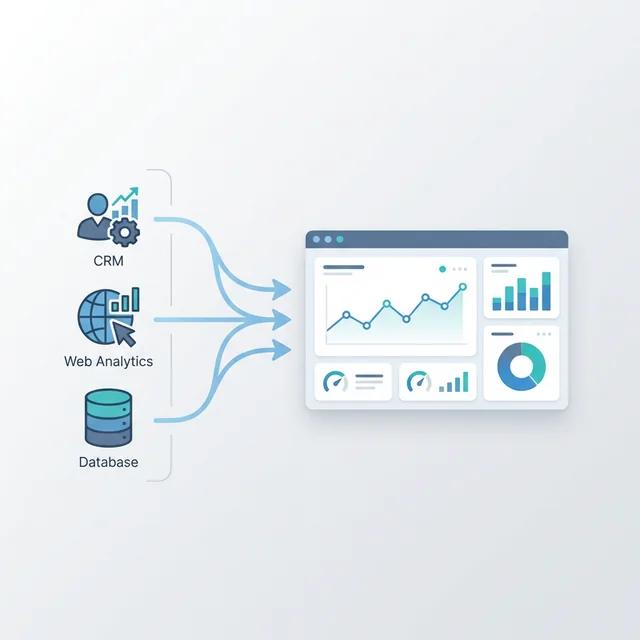
We built a centralized reporting and analytics platform to solve this. It unified data from our CRM, Google Analytics, and internal databases into a single layer that powered near real-time dashboards across the organization.
The Architecture
We built a multi-channel ingestion engine designed to handle both low-latency webhooks and high-latency batch feeds. From direct REST APIs and CRM webhooks to daily SFTP drops from partners, every input was routed through a serverless gateway before entering our processing pipeline.
Each source had its own schema and terminology. A lead in the CRM was a "contact." In Google Analytics it was a "conversion event." In the internal DB it was a "submission." Mapping these to a unified event model took more time than the entire ingestion layer. We built a transformation service in Node.js that parsed, validated, and normalized incoming records before they touched the reporting database.
The system relies on a hybrid architecture: AWS DynamoDB serves as our primary event store for high-frequency logs, while AWS RDS (MySQL) handles structured, read-optimized reporting tables. To keep them in sync, we use DynamoDB Streams to trigger Lambda functions that asynchronously transform and upsert event data into the RDS reporting layer. This ensures that heavy analytical queries never slow down our live data ingestion.
The frontend was built in React with a custom chart layer. We also exposed REST APIs so business teams could connect their preferred tools directly. Traffic, lead flow, conversion funnel, and sales performance were each their own dashboard context, backed by the same data model.
The hardest part of building a reporting platform is not the technology. It is getting five teams with five different definitions of "conversion" to agree on one.
The Daily Data Workflows
Because we operate as an insurance aggregator, our data landscape is deliberately fragmented. Each carrier maintains its own systems and integration preferences. Rather than forcing a common standard, we built an ingestion layer flexible enough to accommodate every pattern they threw at us.
Several carriers deliver daily status files over SFTP. A scheduled Lambda picks up each drop in the early morning, parses the flat file, and reconciles it against our existing lead records. These files carry the information that matters most operationally: application status changes, payment dues, bill dates, and policy issuance confirmations. The reconciliation step is intentionally strict, any row that cannot be matched to a known lead ID gets quarantined and flagged for review rather than silently dropped.
Some of the carriers prefer to push events to us the moment something changes on their end. We expose a thin webhook layer that authenticates each carrier's payload, normalizes it into our internal event schema, and writes it directly to DynamoDB. Because these arrive asynchronously and out of order, each event is timestamped at source and we rely on event-time rather than arrival-time when reporting status history.
Some carriers provide a status API but have no outbound push capability. For these, we run scheduled cronjobs that poll each endpoint at a defined cadence, diff the response against the last known state stored in DynamoDB, and write only the delta. This keeps our write volume manageable and makes it easy to trace exactly when a status transition occurred, even when the carrier's own timestamps are unreliable.
Not everything can be automated. Some carriers communicate through account managers or email threads, and those updates land in the CRM first. An internal tool lets operations staff record the change against the lead, which then triggers a sync job that writes the update directly to DynamoDB. To keep our reporting layer in lockstep, we use DynamoDB Streams to trigger a Lambda function that asynchronously propagates these changes into RDS. Treating the CRM as the system of record for manual touches, rather than asking staff to update two places, was a small discipline decision that saved a significant amount of inconsistency downstream.
Every status change be it a purchase, a winback, a pending requirement added by a carrier, an application approved or declined - fires a message to a dedicated Slack channel through our internal Slack app. The messages are structured: they carry the lead ID, the carrier, the event type, and a deep link into the dashboard/CRM. This was not designed as a replacement for the dashboards. It was designed so that the people closest to a deal hear about critical moments within seconds, without having to poll a screen. The ops team tracks pending requirements. The sales team sees purchases and winbacks. Leadership gets a live pulse on the business without opening another tab.
Taken together, these five channels mean that on any given day, data is arriving through batch files landing at 3 AM, webhooks firing mid-afternoon, cron jobs running every few minutes, manual CRM entries from the operations desk, and real-time Slack pings the moment something closes or lapses. The platform's job is to make all of that coherent by morning.
What We Learned
Invest early in a shared data dictionary. Before writing a single transformation function, we should have locked down definitions: what counts as a lead, what counts as a conversion, what is the canonical way to represent a date range. Ambiguity in definitions creates ambiguity in dashboards, and that costs trust.
Build monitoring into the pipeline from day one. A silent data gap, where a source stops sending events but the dashboard keeps showing the last good state, is much worse than an obvious error. We added freshness checks and alerting to every ingestion job so the team would know within minutes if data was stale.
Design for the business user, not the data engineer. The dashboards exist to help someone make a faster, better decision. If they need to understand the data model to read a chart, the chart is wrong.
The Result
Leadership moved from relying on weekly reporting emails to checking live dashboards before morning standups. Sales teams could see their pipeline in real time. Marketing could tie campaign spend to downstream lead quality, not just clicks. The platform became the single source of truth for the business, and it removed a significant amount of manual reporting burden from the engineering team.